The goal was a predictive model for GPU FP32 throughput in GFLOPS given a set of hardware specifications (transistor count, clock speeds, memory configuration, process node, die size). A hardware company releasing a new chip can use this kind of model to forecast performance from a spec sheet before silicon is back from the fab.
Dataset
497 discrete GPU SKUs across AMD and Nvidia, scraped from TechPowerUp, covering chip generations from 2006 to 2024. 14 predictor variables after cleaning: transistor count, GPU clock, memory size, memory clock, memory type, bus width, process node, transistor density, die size, TDP, L2 cache size, architecture, foundry, generation year. Response variable: FP32 GFLOPS.
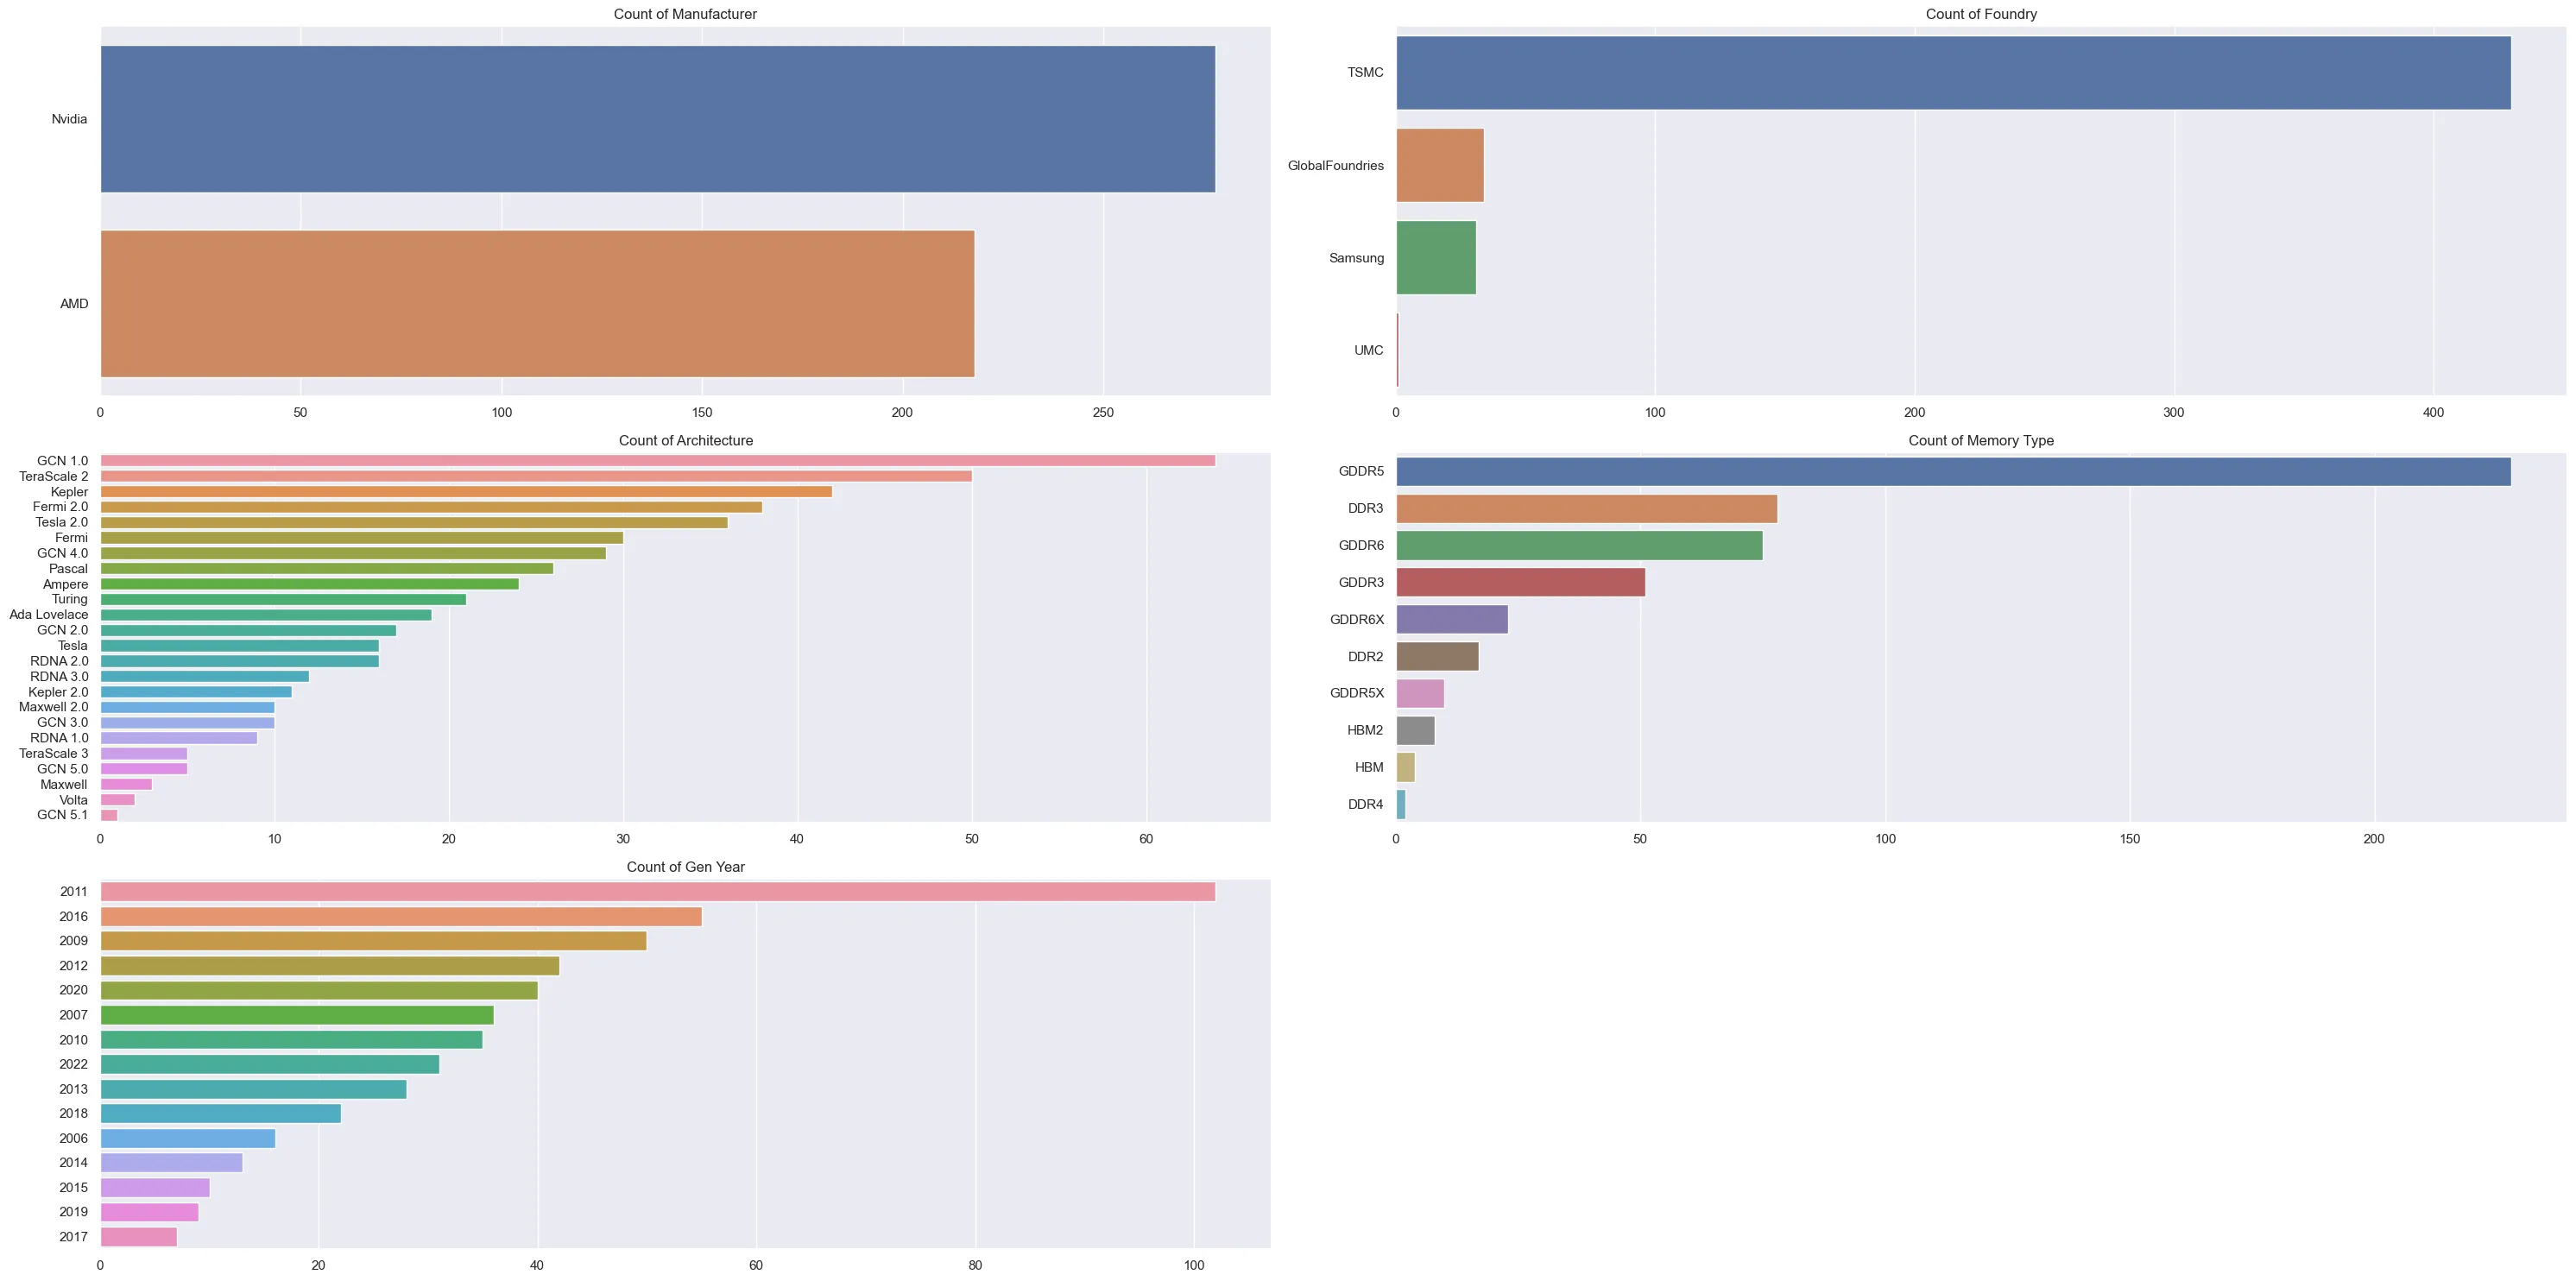
TSMC manufacturing 84% of the chips in the dataset. GDDR5 the most common memory type by a wide margin, followed by DDR3 and GDDR6. The generation year distribution is right-skewed: 2011 has the most SKUs, reflecting the proliferation of GPU variants during the GCN 1.0 / Kepler generation.
EDA
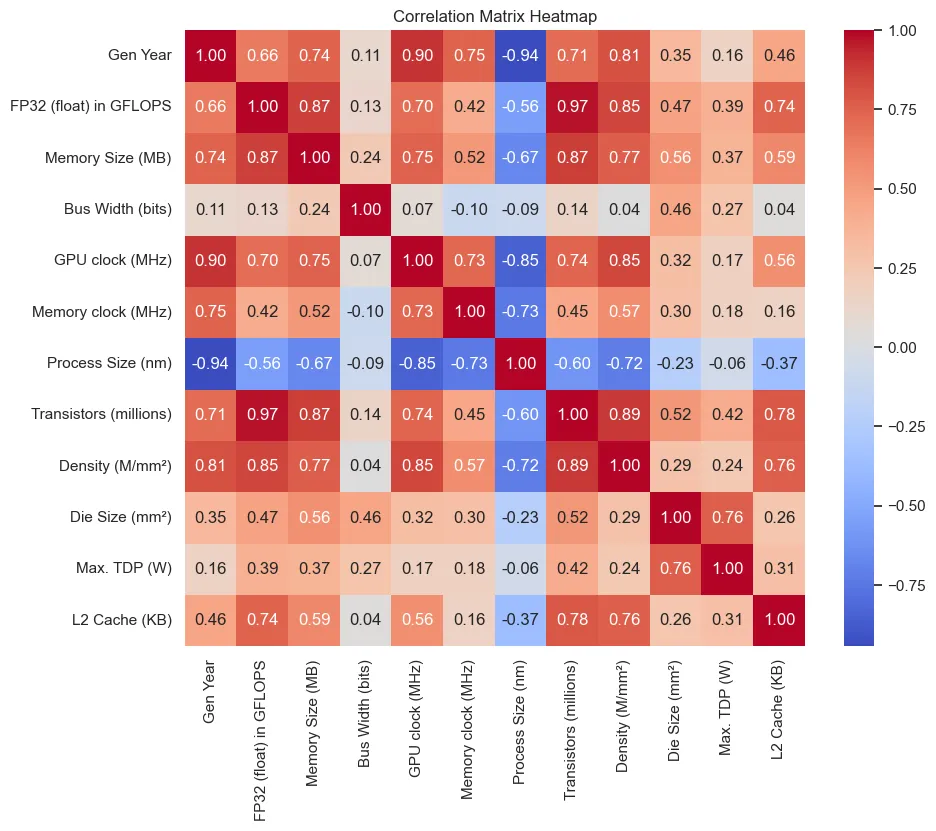
The correlation heatmap shows transistor count at r = 0.97 with FP32 performance, stronger than any other single predictor. GPU clock reaches r = 0.70. Process node correlates negatively at r = −0.56, as expected: smaller nodes mean more transistors per die for the same area. Bus width is an outlier, r = 0.13 with FP32 despite being nominally related to memory bandwidth, probably because it’s dominated by market-segment decisions rather than engineering constraints.
The raw FP32 distribution is heavily right-skewed, a few H100-class chips at 100k+ GFLOPS pulling the tail far out. Log-transforming the response and the skewed predictors (transistors, memory size, density, TDP, L2 cache) before modelling on the combined AMD + Nvidia set tightened predictions across the full range.
Models
Three ensemble methods trained on an 80/20 split (396 train / 100 test). Grid search cross-validation for hyperparameters.
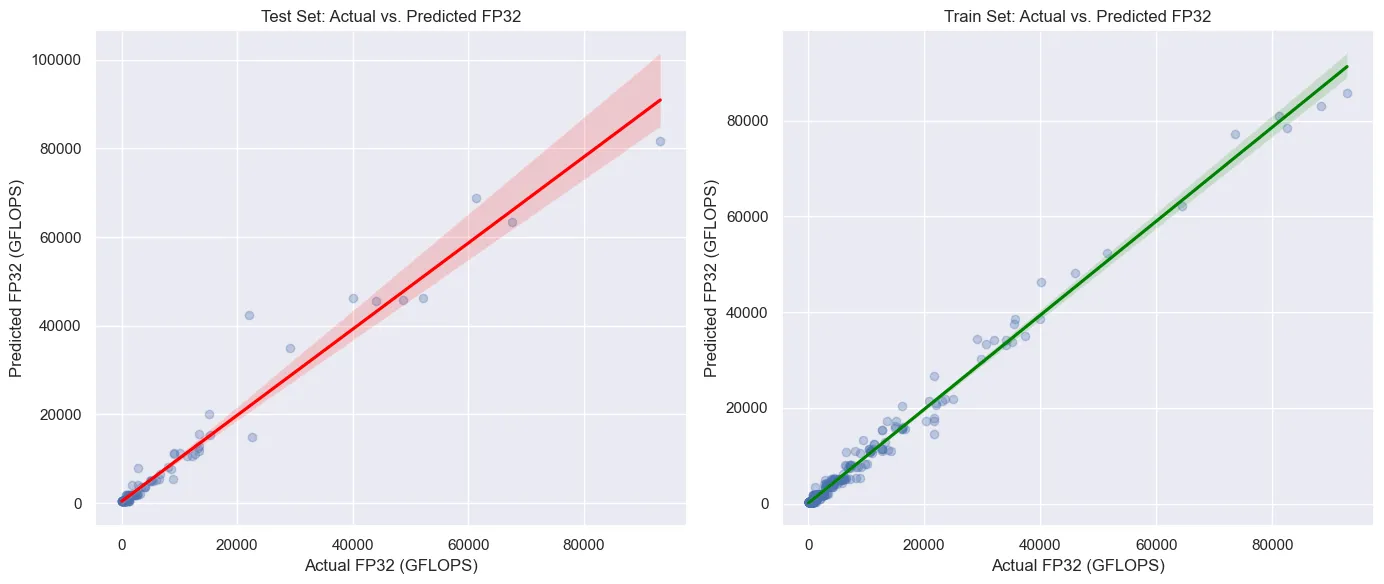
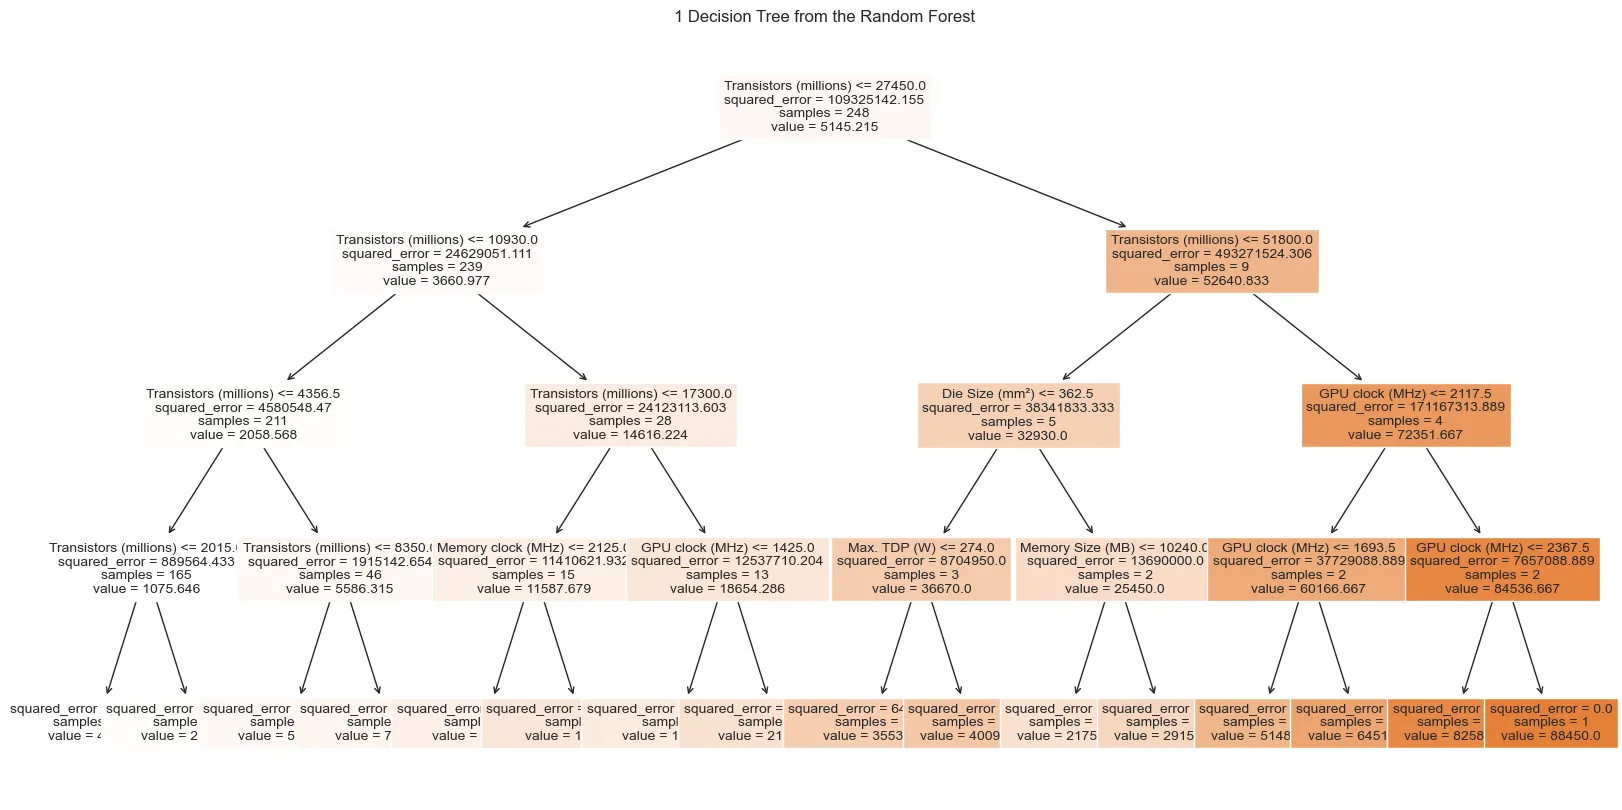
Random Forest (raw features): Train R² 0.995, RMSE 833 / Test R² 0.964, RMSE 2945. Feature importances: Transistors 0.893, GPU clock 0.058, Memory size 0.023.
XGBoost (raw features): Train R² 0.999, RMSE 433 / Test R² 0.981, RMSE 2130. Feature importances: Transistors 0.910, GPU clock 0.034, Memory size 0.010. Best generalisation among the raw-feature models.
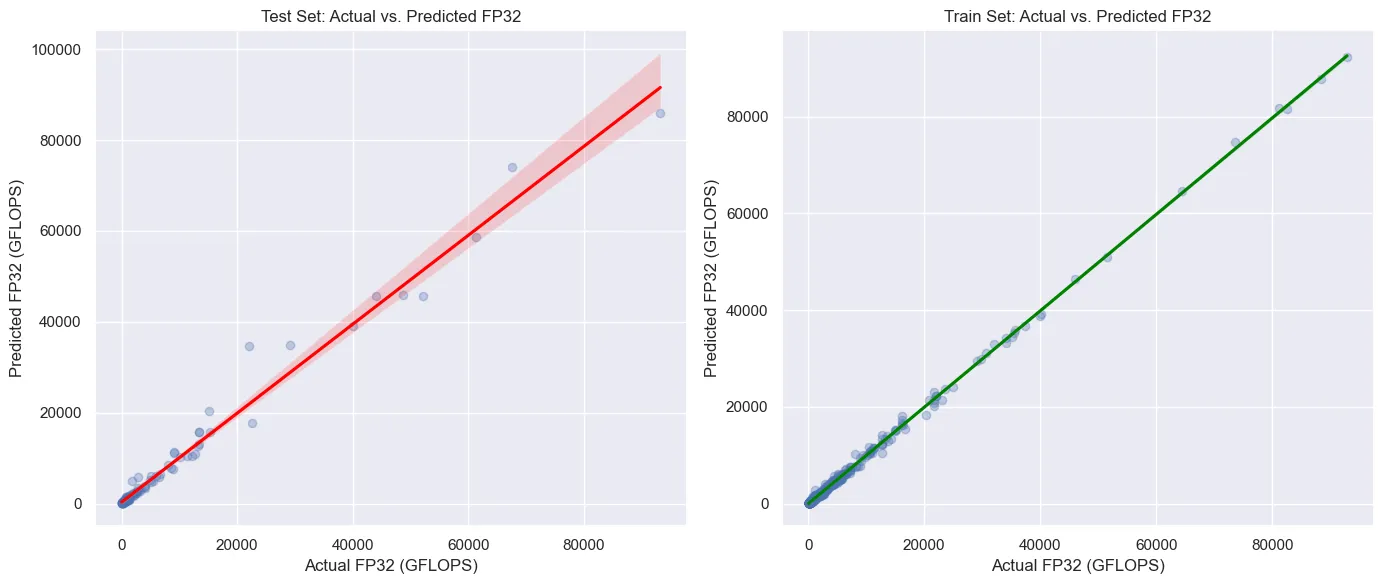
XGBoost (log-transformed features): Train R² 0.995, RMSE 0.117 (log scale) / Test R² 0.984, RMSE 0.226. Applied to the full combined dataset. The log-space model generalises better across the low-GFLOPS range where the raw models compress predictions.
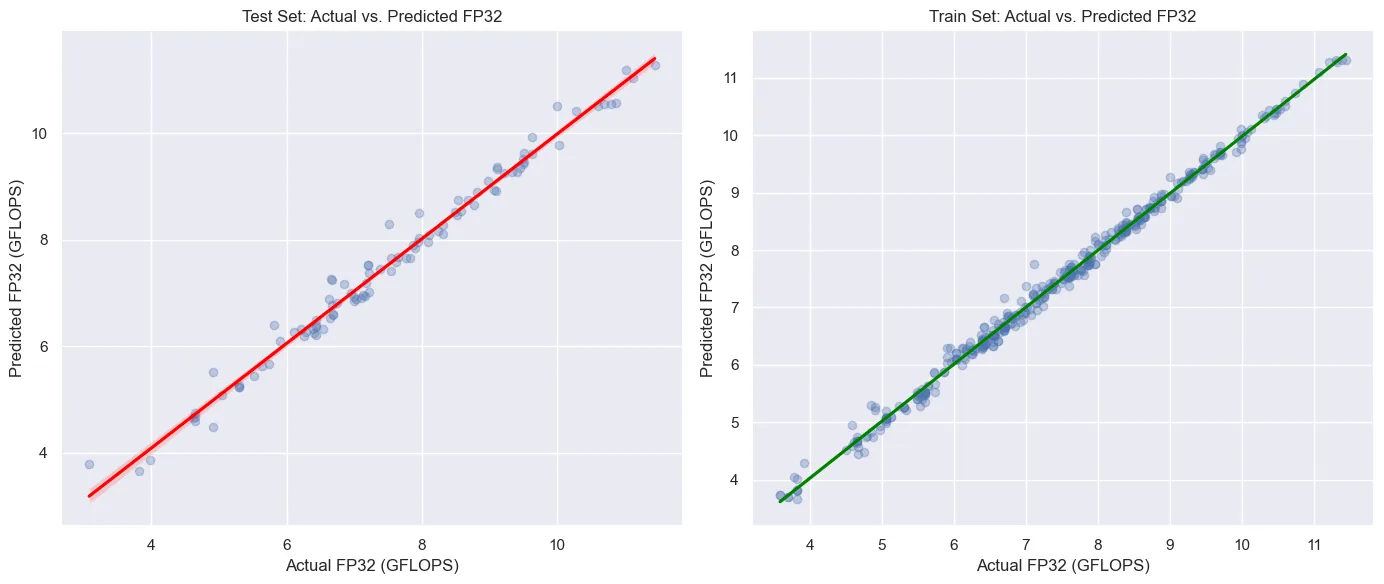
Best model: XGBoost, log-transformed featuresTest R² 0.984, log-RMSE 0.226. Transistors (millions) accounts for 70.6% of feature importance. The log transformation is what makes the model useful at both ends of the performance range; without it, low-GFLOPS predictions cluster and high-end outliers pull the fit.
Feature importance
Transistor count dominates across every model: 0.89 to 0.93 importance depending on the method and feature set. GPU clock is the only other predictor with meaningful weight (0.03 to 0.06). Everything else (memory configuration, bus width, process node) contributes less than 2% individually.
The implication for hardware design: transistor budget and clock frequency are the two levers that move performance. Memory configuration matters for market segmentation and workload type, but it doesn’t show up strongly in a model trained on aggregate FP32 throughput.
Extra: KMeans clustering by foundry
KMeans on the GPU spec features, k=5 (elbow method), to see whether clusters aligned with foundries. TSMC appears across all five clusters and dominates the highest-performance cluster. GlobalFoundries and Samsung concentrate in mid-range and low-end clusters. The result matches what the bar chart shows directly: TSMC is the process node choice across the full performance spectrum, not just the high end.
Stack
- Python: pandas, scikit-learn, XGBoost, matplotlib, seaborn
- Data scraping: TechPowerUp (AMD 218 SKUs, Nvidia 279 SKUs)
- Models: Random Forest, XGBoost, Gradient Boosting, Multi-Output Regressor, KMeans